Numercial Data Explore
discrete
- AGE_GROUP
- OLIG_PROTE_CD
countinous
- HEIGHT
- WEIGHT
- WAIST
- SIGHT_LEFT
- SIGHT_RIGHT
- BP_HIGH
- BP_LWST
- TOT_CHOLE
- TRIGLYCERIDE
- HDL_CHOLE
- LDL_CHOLE
- HMG
- CREATININE
- SGOT_AST
- SGPT_ALT
- GAMMA_GTP
Discrete Feature
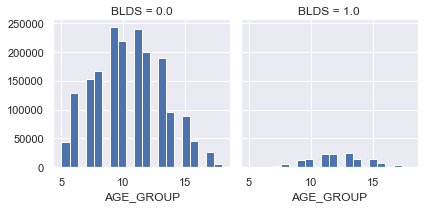
AGE_GROUP
결측치 없음
정규분포를 따른다
40대 이상 사람들이 당뇨병걸릴 확률이 높다
g = sns.FacetGrid(df, col='BLDS')
g.map(plt.hist, 'AGE_GROUP', bins=20)
<seaborn.axisgrid.FacetGrid at 0x7fbcfec04dc0>
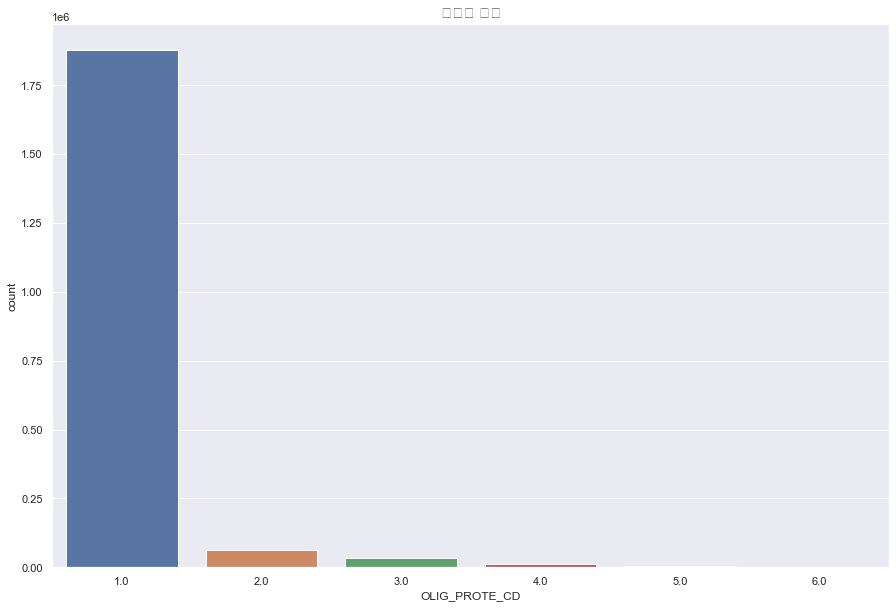
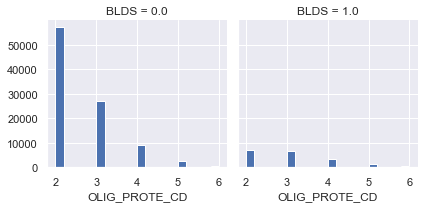
OLIG_PROTE_CD(요단백 수치)
결측치 9274
포아송분포? 지수분포? 멱분포? 절대 정규분포를 따르지 않는다.
OLIG_PROTE_CD는 압도적으로 1이 많으므로 결측치는 전부 1로 채워주도록 한다.
df['OLIG_PROTE_CD'].fillna(1, inplace = True)
plt.figure(figsize=(15,10))
sns.countplot(df['OLIG_PROTE_CD'])
plt.title("요단백 수치",fontsize=15)
plt.show()
g = sns.FacetGrid(df[df['OLIG_PROTE_CD'] > 1], col='BLDS')
g.map(plt.hist, 'OLIG_PROTE_CD', bins=20)
<seaborn.axisgrid.FacetGrid at 0x7fbcfd8ccd30>
Continous Feature
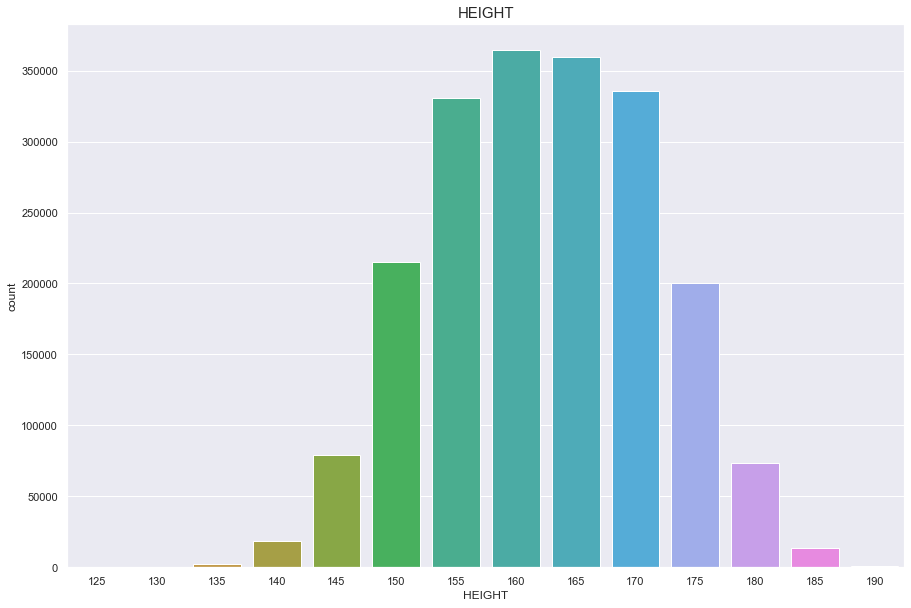
Height
결측치 없음
정규분포를 따름
plt.figure(figsize=(15,10))
sns.countplot(df['HEIGHT'])
plt.title("HEIGHT",fontsize=15)
plt.show()
/Users/minsuha/anaconda3/lib/python3.8/site-packages/seaborn/_decorators.py:36: FutureWarning: Pass the following variable as a keyword arg: x. From version 0.12, the only valid positional argument will be `data`, and passing other arguments without an explicit keyword will result in an error or misinterpretation.
  warnings.warn(
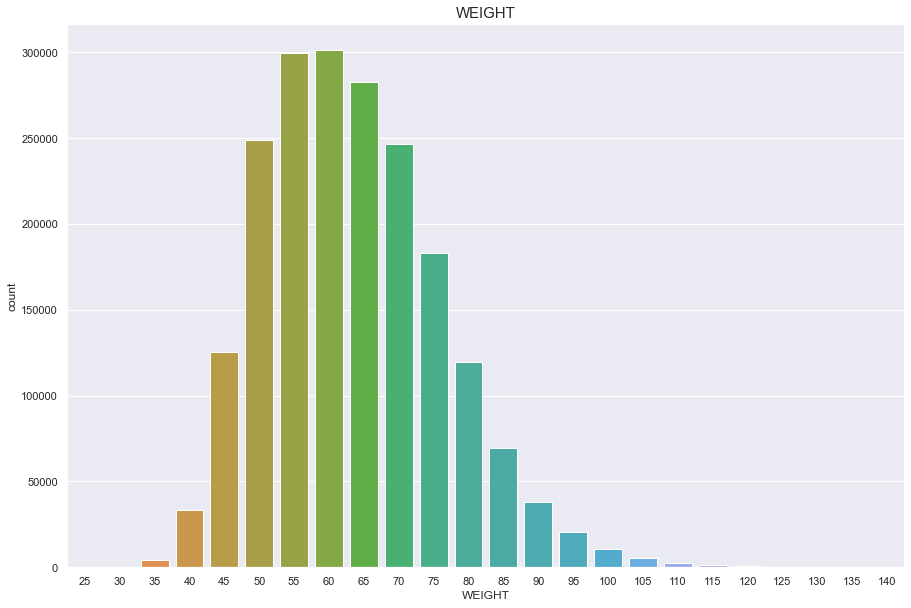
WEIGHT
결측치 없음
정규분포를 따름
plt.figure(figsize=(15,10))
sns.countplot(df['WEIGHT'])
plt.title("WEIGHT",fontsize=15)
plt.show()
/Users/minsuha/anaconda3/lib/python3.8/site-packages/seaborn/_decorators.py:36: FutureWarning: Pass the following variable as a keyword arg: x. From version 0.12, the only valid positional argument will be `data`, and passing other arguments without an explicit keyword will result in an error or misinterpretation.
  warnings.warn(
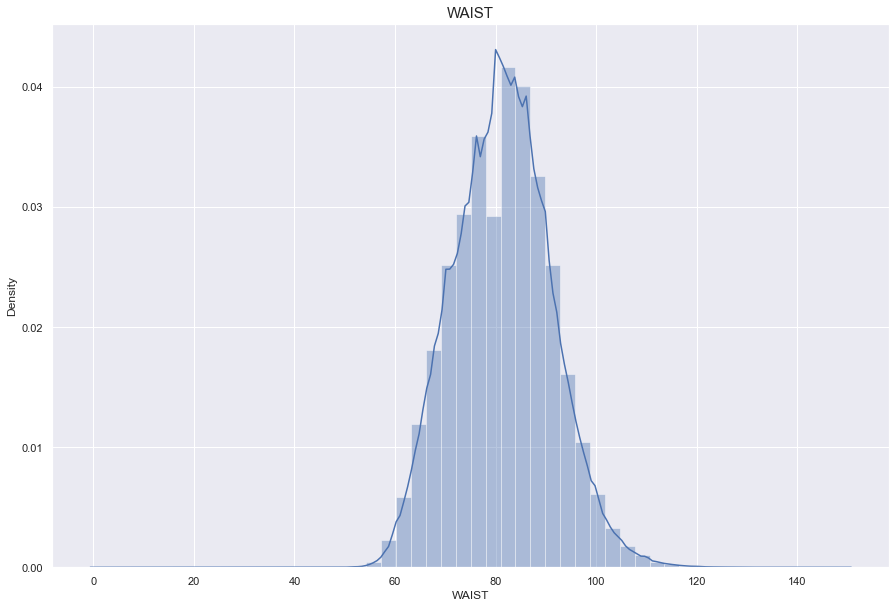
WAIST
결측치 680개
이상치(999) 70개
허리둘레는 비만도와 관련있으므로, BMI feature를 생성하고 결측치를 채운다
BMI와 WAIST는 상관도가 0.8로 높은 상관성을 가진다.
WAIST_LM 이라는 새로운 column을 만들어 결측치를 쳐리해준다.
print("The average person waist for {:.1f}cm, 99% of people is {}cm or less, while the biggest waist {}cm.".format(df['WAIST'].mean(), df['WAIST'].quantile(0.99), df['WAIST'].max()))
The average person waist for 81.3cm, 99% of people is 105.0cm or less, while the biggest waist 999.0cm.
# 900이상의 허리둘레는 잘못 기입된 값이므로 이상치로 처리한다.
df['WAIST'] = np.where(df['WAIST']>900, np.nan, df['WAIST'])
plt.figure(figsize=(15,10))
sns.distplot(df['WAIST'])
plt.title("WAIST",fontsize=15)
plt.show()
/Users/minsuha/anaconda3/lib/python3.8/site-packages/seaborn/distributions.py:2551: FutureWarning: `distplot` is a deprecated function and will be removed in a future version. Please adapt your code to use either `displot` (a figure-level function with similar flexibility) or `histplot` (an axes-level function for histograms).
  warnings.warn(msg, FutureWarning)
create BMI feature
df['BMI'] = df['WEIGHT'] / (df['HEIGHT']/100)**2
sns.jointplot(x="BMI", y="WAIST", data=df)
plt.suptitle("BMI수치와 허리둘레", y=1.02)
plt.show()
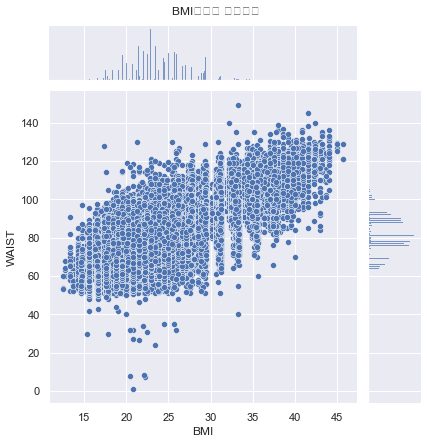
# BMI와 허리둘레는 높은 상관관계를 가진다.
df[['BMI','WAIST']].corr()
| BMI | WAIST | |
|---|---|---|
| BMI | 1.000000 | 0.802917 |
| WAIST | 0.802917 | 1.000000 |
Linear Regression으로 WAIST 결측치 및 이상치 채우기
70% 정도의 정확성을 가진 Linear Regression 모델로 WAIST결측치를 채운 새로운 WAIST_LM feature를 생성하고 기존 WAIST는 삭제
from sklearn.linear_model import LinearRegression
from sklearn.model_selection import train_test_split

df_copy = df[df['WAIST'].notnull()][['BMI', 'WAIST', 'HEIGHT', 'WEIGHT']]
X_train, X_test, y_train, y_test = train_test_split(df_copy[['BMI', 'HEIGHT', 'WEIGHT']],
                                                    df_copy['WAIST'], random_state=42)
print(X_train.shape, X_test.shape, y_train.shape, y_test.shape)
lr = LinearRegression()
lr.fit(X_train, y_train)
lr.score(X_test, y_test)
(1494975, 3) (498326, 3) (1494975,) (498326,)

#모델 정확도
0.7010780973495436
print(lr.coef_, lr.intercept_)
[1.78121448 0.15046672 0.12376376] 6.352174058556571
# 결측치가 없으면 기존값, 결측치면 precict값으로 채운 새로운 feature WAIST_LM
df['WAIST_pred'] = lr.predict(df[['BMI', 'HEIGHT', 'WEIGHT']])
df['WAIST_LM'] = np.where(df['WAIST_pred']>0, df['WAIST'], df['WAIST_pred'])
# 기존 WAIST, predict로만 구성된 WAIST_pred 삭제
drop_cols = ['WAIST_pred', 'WAIST']
df.drop(drop_cols, axis = 1, inplace = True)
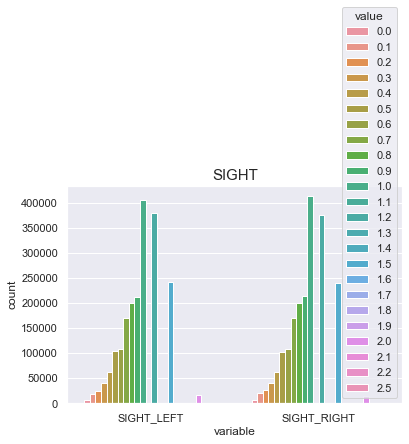
SIGHT
실명한사람(9.9) -> 0
BLDS와의 상관관계가 0이므로 시력 평균치인 1을 결측치 464개에 대입
print("The average person sight_left for {:.1f}, 99% of people is {} or less, while the biggest sight_left {}.".format(df['SIGHT_LEFT'].mean(), df['SIGHT_LEFT'].quantile(0.99), df['SIGHT_LEFT'].max()))
print("The average person sight_right for {:.1f}, 99% of people is {} or less, while the biggest sight_right {}.".format(df['SIGHT_RIGHT'].mean(), df['SIGHT_RIGHT'].quantile(0.99), df['SIGHT_RIGHT'].max()))
The average person sight_left for 1.0, 99% of people is 2.0 or less, while the biggest sight_left 9.9.
The average person sight_right for 1.0, 99% of people is 2.0 or less, while the biggest sight_right 9.9.
df['SIGHT_LEFT'] = np.where(df['SIGHT_LEFT']>2.5, 0, df['SIGHT_LEFT'])
df['SIGHT_RIGHT'] = np.where(df['SIGHT_RIGHT']>2.5, 0, df['SIGHT_RIGHT'])
sns.countplot(x="variable", hue="value", data=pd.melt(df[['SIGHT_LEFT', 'SIGHT_RIGHT']]))
plt.title("SIGHT",fontsize=15)
plt.show()
df[(df['SIGHT_LEFT'].isnull()) | (df['SIGHT_RIGHT'].isnull())].shape
(464, 45)
df[['SIGHT_LEFT', 'SIGHT_RIGHT','BLDS']].corr()
| SIGHT_LEFT | SIGHT_RIGHT | BLDS | |
|---|---|---|---|
| SIGHT_LEFT | 1.00000 | 0.711090 | -0.081750 |
| SIGHT_RIGHT | 0.71109 | 1.000000 | -0.080196 |
| BLDS | -0.08175 | -0.080196 | 1.000000 |
df['SIGHT_LEFT'].fillna(1, inplace = True)
df['SIGHT_RIGHT'].fillna(1, inplace = True)
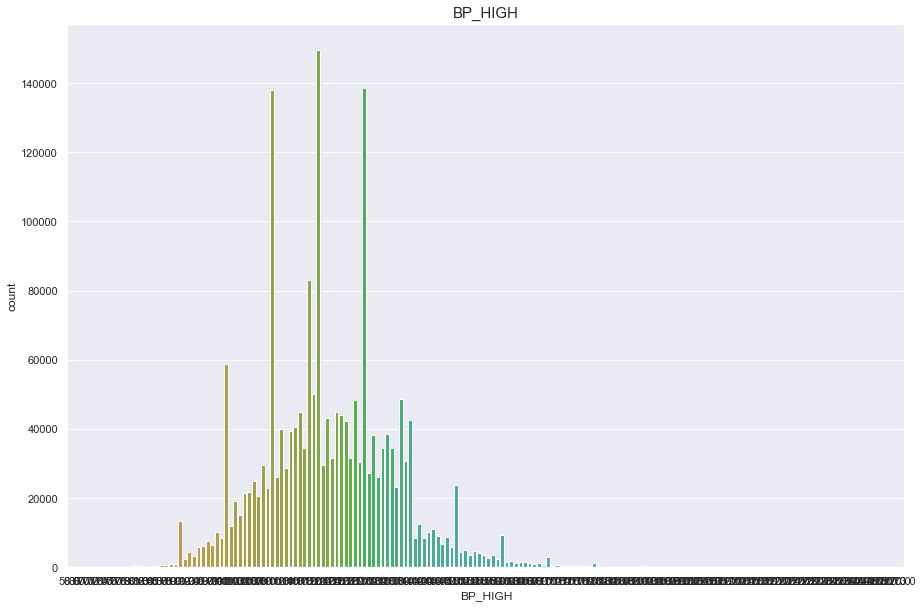
BP_HIGH
결측치 40개
- 40개의 결측치는 평균으로 매꾼다.
10자리 단위마다 데이터가 몰려있는것으로 보아 반올림의 문제인듯하다
구간을 20개로 나누어 discrete 형태로 변형시켜 안정적인 정규분포를 따르게 바꿨다.
print("Average BP_HIGH : {:.1f}, 99% of people is {} or less, 1% of people is {} or less, max BP_HIGH : {}, min BP_HIGH {}".format(df['BP_HIGH'].mean(), df['BP_HIGH'].quantile(0.99), df['BP_HIGH'].quantile(0.01), df['BP_HIGH'].max(), df['BP_HIGH'].min()))
Average BP_HIGH : 122.5, 99% of people is 162.0 or less, 1% of people is 91.0 or less, max BP_HIGH : 273.0, min BP_HIGH 58.0
plt.figure(figsize=(15,10))
sns.countplot(df['BP_HIGH'])
plt.title("BP_HIGH",fontsize=15)
plt.show()
/Users/minsuha/anaconda3/lib/python3.8/site-packages/seaborn/_decorators.py:36: FutureWarning: Pass the following variable as a keyword arg: x. From version 0.12, the only valid positional argument will be `data`, and passing other arguments without an explicit keyword will result in an error or misinterpretation.
  warnings.warn(
df['BP_HIGH_BD'] = pd.cut(df['BP_HIGH'], 20, labels=[x for x in range(20)])
df.drop(['BP_HIGH'], axis = 1, inplace = True)
df.head()
| SEX | AGE_GROUP | HEIGHT | WEIGHT | SIGHT_LEFT | SIGHT_RIGHT | HEAR_LEFT | HEAR_RIGHT | BP_LWST | BLDS | TOT_CHOLE | TRIGLYCERIDE | HDL_CHOLE | LDL_CHOLE | HMG | OLIG_PROTE_CD | CREATININE | SGOT_AST | SGPT_ALT | GAMMA_GTP | SMK_STAT_TYPE_CD | DRK_YN | HCHK_OE_INSPEC_YN | CRS_YN | TTR_YN | SIDO_50 | SIDO_busan | SIDO_chongB | SIDO_chongN | SIDO_dagu | SIDO_dajeon | SIDO_gangwon | SIDO_gyeongB | SIDO_gyeongN | SIDO_gyeonggi | SIDO_incheon | SIDO_jeonB | SIDO_jeonN | SIDO_kwangju | SIDO_sejong | SIDO_seoul | SIDO_ulsan | BMI | WAIST_LM | BP_HIGH_BD | |
|---|---|---|---|---|---|---|---|---|---|---|---|---|---|---|---|---|---|---|---|---|---|---|---|---|---|---|---|---|---|---|---|---|---|---|---|---|---|---|---|---|---|---|---|---|---|
| 0 | 1 | 8 | 170 | 75 | 1.0 | 1.0 | 1.0 | 1.0 | 80.0 | 0.0 | 193.0 | 92.0 | 48.0 | 126.0 | 17.1 | 1.0 | 1.0 | 21.0 | 35.0 | 40.0 | 1.0 | 1.0 | 1 | NaN | 1.0 | 0 | 0 | 1 | 0 | 0 | 0 | 0 | 0 | 0 | 0 | 0 | 0 | 0 | 0 | 0 | 0 | 0 | 25.951557 | 90.0 | 5 |
| 1 | 1 | 7 | 180 | 80 | 0.9 | 1.2 | 1.0 | 1.0 | 82.0 | 0.0 | 228.0 | 121.0 | 55.0 | 148.0 | 15.8 | 1.0 | 0.9 | 20.0 | 36.0 | 27.0 | 0.0 | 0.0 | 1 | NaN | 2.0 | 0 | 0 | 0 | 0 | 0 | 0 | 0 | 0 | 0 | 0 | 0 | 0 | 0 | 0 | 0 | 1 | 0 | 24.691358 | 89.0 | 6 |
| 2 | 1 | 9 | 165 | 75 | 1.2 | 1.5 | 1.0 | 1.0 | 70.0 | 0.0 | 136.0 | 104.0 | 41.0 | 74.0 | 15.8 | 1.0 | 0.9 | 47.0 | 32.0 | 68.0 | 1.0 | 0.0 | 0 | NaN | NaN | 0 | 0 | 0 | 0 | 0 | 0 | 0 | 0 | 0 | 1 | 0 | 0 | 0 | 0 | 0 | 0 | 0 | 27.548209 | 91.0 | 5 |
| 3 | 1 | 11 | 175 | 80 | 1.5 | 1.2 | 1.0 | 1.0 | 87.0 | 0.0 | 201.0 | 106.0 | 76.0 | 104.0 | 17.6 | 1.0 | 1.1 | 29.0 | 34.0 | 18.0 | 1.0 | 0.0 | 1 | NaN | 0.0 | 0 | 0 | 0 | 0 | 0 | 0 | 0 | 0 | 1 | 0 | 0 | 0 | 0 | 0 | 0 | 0 | 0 | 26.122449 | 91.0 | 8 |
| 4 | 1 | 11 | 165 | 60 | 1.0 | 1.2 | 1.0 | 1.0 | 82.0 | 0.0 | 199.0 | 104.0 | 61.0 | 117.0 | 13.8 | 1.0 | 0.8 | 19.0 | 12.0 | 25.0 | 1.0 | 0.0 | 1 | NaN | 0.0 | 0 | 0 | 0 | 0 | 0 | 1 | 0 | 0 | 0 | 0 | 0 | 0 | 0 | 0 | 0 | 0 | 0 | 22.038567 | 80.0 | 7 |
plt.figure(figsize=(15,10))
sns.countplot(df['BP_HIGH_BD'])
plt.title("BP_HIGH",fontsize=15)
plt.show()
/Users/minsuha/anaconda3/lib/python3.8/site-packages/seaborn/_decorators.py:36: FutureWarning: Pass the following variable as a keyword arg: x. From version 0.12, the only valid positional argument will be `data`, and passing other arguments without an explicit keyword will result in an error or misinterpretation.
  warnings.warn(
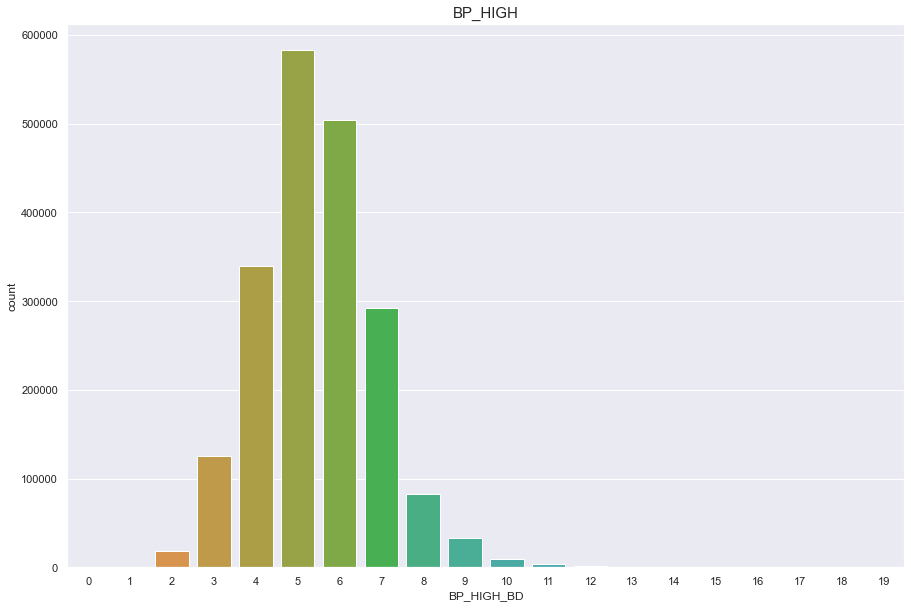
df['BP_HIGH_BD'].fillna(5, inplace = True)
df = df.astype({'BP_HIGH_BD': 'int'})
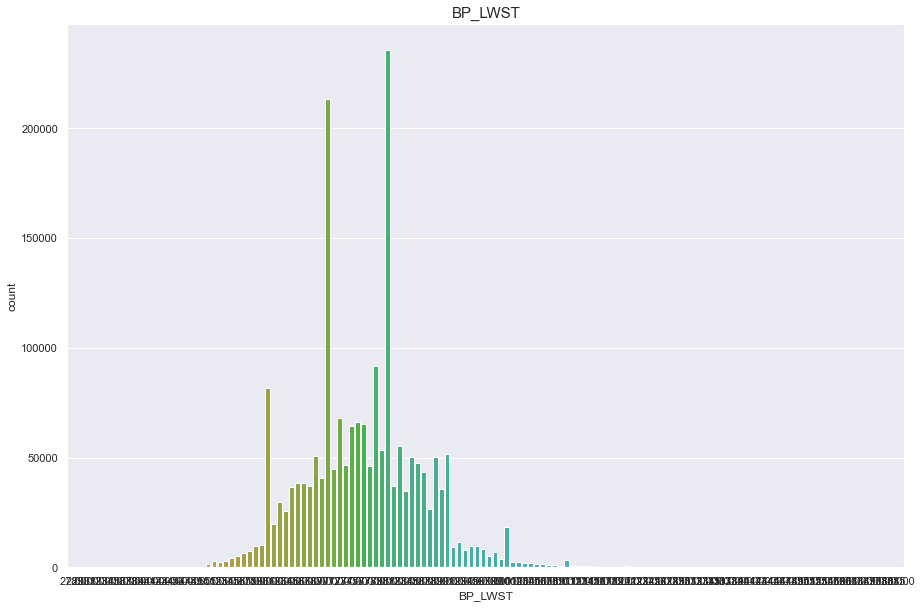
BP_LWST
결측치 40개
- 40개의 결측치는 평균으로 매꾼다.
10자리 단위마다 데이터가 몰려있는것으로 보아 반올림의 문제인듯하다
구간을 20개로 나누어 discrete 형태로 변형시켜 안정적인 정규분포를 따르게 바꿨다.
print("Average BP_LWST : {:.1f}, 99% of people is {} or less, 1% of people is {} or less, max BP_LWST : {}, min BP_LWST {}".format(df['BP_LWST'].mean(), df['BP_LWST'].quantile(0.99), df['BP_LWST'].quantile(0.01), df['BP_LWST'].max(), df['BP_LWST'].min()))
Average BP_LWST : 76.1, 99% of people is 102.0 or less, 1% of people is 56.0 or less, max BP_LWST : 185.0, min BP_LWST 27.0
plt.figure(figsize=(15,10))
sns.countplot(df['BP_LWST'])
plt.title("BP_LWST",fontsize=15)
plt.show()
/Users/minsuha/anaconda3/lib/python3.8/site-packages/seaborn/_decorators.py:36: FutureWarning: Pass the following variable as a keyword arg: x. From version 0.12, the only valid positional argument will be `data`, and passing other arguments without an explicit keyword will result in an error or misinterpretation.
  warnings.warn(
df['BP_LWST_BD'] = pd.cut(df['BP_LWST'],20, labels=[x for x in range(20)])
df.drop(['BP_LWST'], axis = 1, inplace = True)
df.head()
| SEX | AGE_GROUP | HEIGHT | WEIGHT | SIGHT_LEFT | SIGHT_RIGHT | HEAR_LEFT | HEAR_RIGHT | BLDS | TOT_CHOLE | TRIGLYCERIDE | HDL_CHOLE | LDL_CHOLE | HMG | OLIG_PROTE_CD | CREATININE | SGOT_AST | SGPT_ALT | GAMMA_GTP | SMK_STAT_TYPE_CD | DRK_YN | HCHK_OE_INSPEC_YN | CRS_YN | TTR_YN | SIDO_50 | SIDO_busan | SIDO_chongB | SIDO_chongN | SIDO_dagu | SIDO_dajeon | SIDO_gangwon | SIDO_gyeongB | SIDO_gyeongN | SIDO_gyeonggi | SIDO_incheon | SIDO_jeonB | SIDO_jeonN | SIDO_kwangju | SIDO_sejong | SIDO_seoul | SIDO_ulsan | BMI | WAIST_LM | BP_HIGH_BD | BP_LWST_BD | |
|---|---|---|---|---|---|---|---|---|---|---|---|---|---|---|---|---|---|---|---|---|---|---|---|---|---|---|---|---|---|---|---|---|---|---|---|---|---|---|---|---|---|---|---|---|---|
| 0 | 1 | 8 | 170 | 75 | 1.0 | 1.0 | 1.0 | 1.0 | 0.0 | 193.0 | 92.0 | 48.0 | 126.0 | 17.1 | 1.0 | 1.0 | 21.0 | 35.0 | 40.0 | 1.0 | 1.0 | 1 | NaN | 1.0 | 0 | 0 | 1 | 0 | 0 | 0 | 0 | 0 | 0 | 0 | 0 | 0 | 0 | 0 | 0 | 0 | 0 | 25.951557 | 90.0 | 5 | 6 |
| 1 | 1 | 7 | 180 | 80 | 0.9 | 1.2 | 1.0 | 1.0 | 0.0 | 228.0 | 121.0 | 55.0 | 148.0 | 15.8 | 1.0 | 0.9 | 20.0 | 36.0 | 27.0 | 0.0 | 0.0 | 1 | NaN | 2.0 | 0 | 0 | 0 | 0 | 0 | 0 | 0 | 0 | 0 | 0 | 0 | 0 | 0 | 0 | 0 | 1 | 0 | 24.691358 | 89.0 | 6 | 6 |
| 2 | 1 | 9 | 165 | 75 | 1.2 | 1.5 | 1.0 | 1.0 | 0.0 | 136.0 | 104.0 | 41.0 | 74.0 | 15.8 | 1.0 | 0.9 | 47.0 | 32.0 | 68.0 | 1.0 | 0.0 | 0 | NaN | NaN | 0 | 0 | 0 | 0 | 0 | 0 | 0 | 0 | 0 | 1 | 0 | 0 | 0 | 0 | 0 | 0 | 0 | 27.548209 | 91.0 | 5 | 5 |
| 3 | 1 | 11 | 175 | 80 | 1.5 | 1.2 | 1.0 | 1.0 | 0.0 | 201.0 | 106.0 | 76.0 | 104.0 | 17.6 | 1.0 | 1.1 | 29.0 | 34.0 | 18.0 | 1.0 | 0.0 | 1 | NaN | 0.0 | 0 | 0 | 0 | 0 | 0 | 0 | 0 | 0 | 1 | 0 | 0 | 0 | 0 | 0 | 0 | 0 | 0 | 26.122449 | 91.0 | 8 | 7 |
| 4 | 1 | 11 | 165 | 60 | 1.0 | 1.2 | 1.0 | 1.0 | 0.0 | 199.0 | 104.0 | 61.0 | 117.0 | 13.8 | 1.0 | 0.8 | 19.0 | 12.0 | 25.0 | 1.0 | 0.0 | 1 | NaN | 0.0 | 0 | 0 | 0 | 0 | 0 | 1 | 0 | 0 | 0 | 0 | 0 | 0 | 0 | 0 | 0 | 0 | 0 | 22.038567 | 80.0 | 7 | 6 |
plt.figure(figsize=(15,10))
sns.countplot(df['BP_LWST_BD'])
plt.title("BP_LWST",fontsize=15)
plt.show()
/Users/minsuha/anaconda3/lib/python3.8/site-packages/seaborn/_decorators.py:36: FutureWarning: Pass the following variable as a keyword arg: x. From version 0.12, the only valid positional argument will be `data`, and passing other arguments without an explicit keyword will result in an error or misinterpretation.
  warnings.warn(
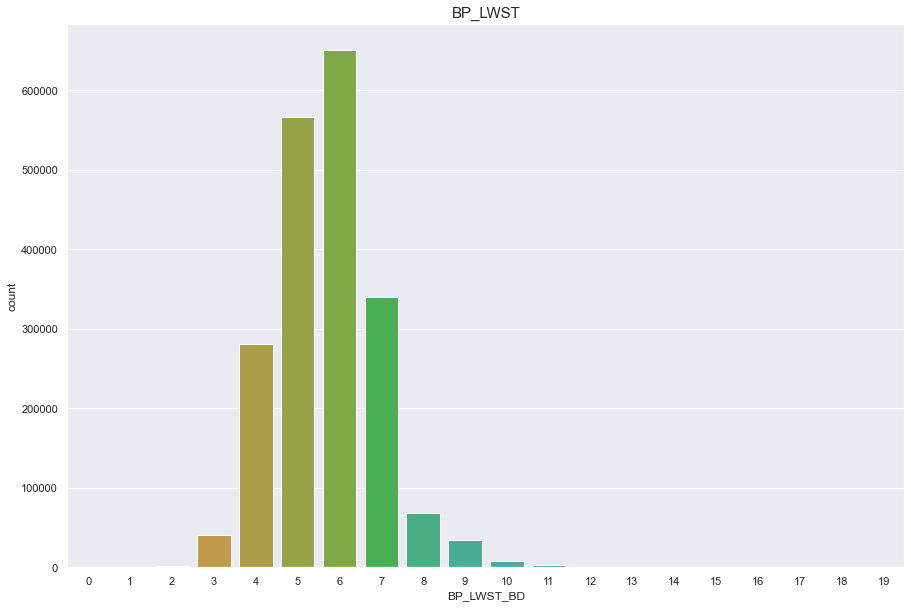
df['BP_LWST_BD'].fillna(6, inplace = True)
df = df.astype({'BP_LWST_BD': 'int'})
df.info()
<class 'pandas.core.frame.DataFrame'>
Int64Index: 1994043 entries, 0 to 999999
Data columns (total 45 columns):
 #   Column             Dtype
---  ------             -----
 0   SEX                int64
 1   AGE_GROUP          int64
 2   HEIGHT             int64
 3   WEIGHT             int64
 4   SIGHT_LEFT         float64
 5   SIGHT_RIGHT        float64
 6   HEAR_LEFT          float64
 7   HEAR_RIGHT         float64
 8   BLDS               float64
 9   TOT_CHOLE          float64
 10  TRIGLYCERIDE       float64
 11  HDL_CHOLE          float64
 12  LDL_CHOLE          float64
 13  HMG                float64
 14  OLIG_PROTE_CD      float64
 15  CREATININE         float64
 16  SGOT_AST           float64
 17  SGPT_ALT           float64
 18  GAMMA_GTP          float64
 19  SMK_STAT_TYPE_CD   float64
 20  DRK_YN             float64
 21  HCHK_OE_INSPEC_YN  int64
 22  CRS_YN             float64
 23  TTR_YN             float64
 24  SIDO_50            uint8
 25  SIDO_busan         uint8
 26  SIDO_chongB        uint8
 27  SIDO_chongN        uint8
 28  SIDO_dagu          uint8
 29  SIDO_dajeon        uint8
 30  SIDO_gangwon       uint8
 31  SIDO_gyeongB       uint8
 32  SIDO_gyeongN       uint8
 33  SIDO_gyeonggi      uint8
 34  SIDO_incheon       uint8
 35  SIDO_jeonB         uint8
 36  SIDO_jeonN         uint8
 37  SIDO_kwangju       uint8
 38  SIDO_sejong        uint8
 39  SIDO_seoul         uint8
 40  SIDO_ulsan         uint8
 41  BMI                float64
 42  WAIST_LM           float64
 43  BP_HIGH_BD         int64
 44  BP_LWST_BD         int64
dtypes: float64(21), int64(7), uint8(17)
memory usage: 513.5 MB
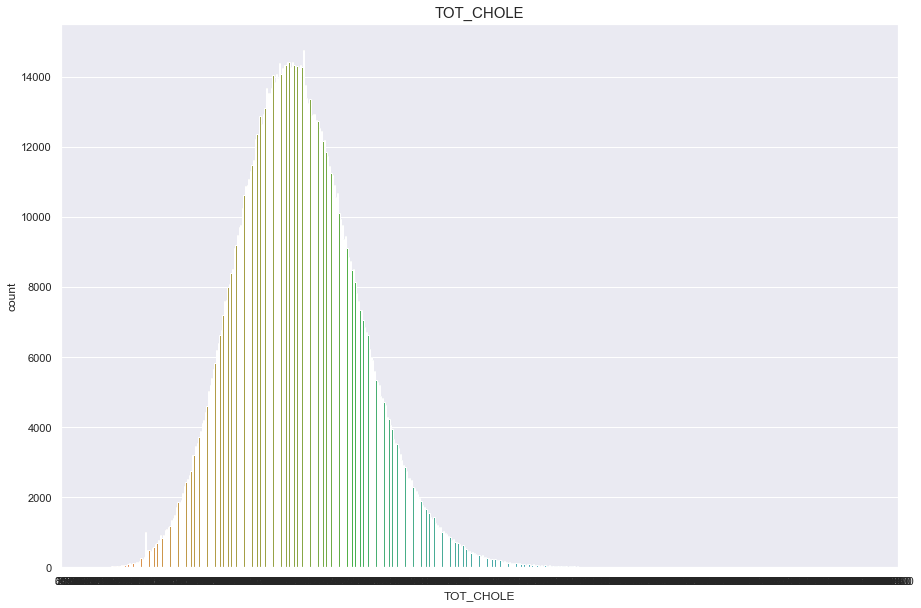
TOT_CHOLE
너무많은 결측치(661336)가 있기 때문에 보류
df['TOT_CHOLE'].isnull().sum()
661336
plt.figure(figsize=(15,10))
sns.countplot(df['TOT_CHOLE'])
plt.title("TOT_CHOLE",fontsize=15)
plt.show()
/Users/minsuha/anaconda3/lib/python3.8/site-packages/seaborn/_decorators.py:36: FutureWarning: Pass the following variable as a keyword arg: x. From version 0.12, the only valid positional argument will be `data`, and passing other arguments without an explicit keyword will result in an error or misinterpretation.
  warnings.warn(
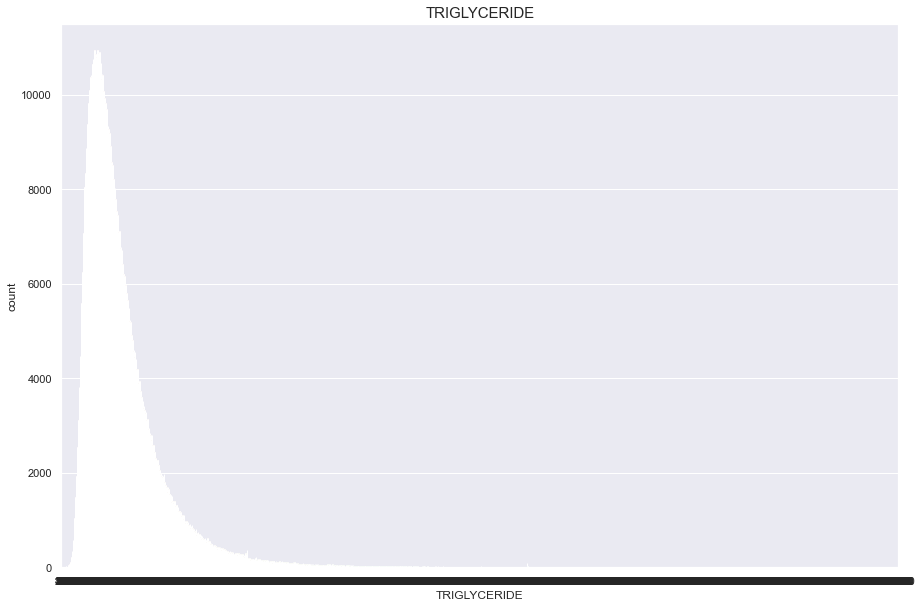
TRIGLYCERIDE
너무많은 결측치(661346)가 있기 때문에 보류
df['TRIGLYCERIDE'].isnull().sum()
661346
plt.figure(figsize=(15,10))
sns.countplot(df['TRIGLYCERIDE'])
plt.title("TRIGLYCERIDE",fontsize=15)
plt.show()
/Users/minsuha/anaconda3/lib/python3.8/site-packages/seaborn/_decorators.py:36: FutureWarning: Pass the following variable as a keyword arg: x. From version 0.12, the only valid positional argument will be `data`, and passing other arguments without an explicit keyword will result in an error or misinterpretation.
  warnings.warn(
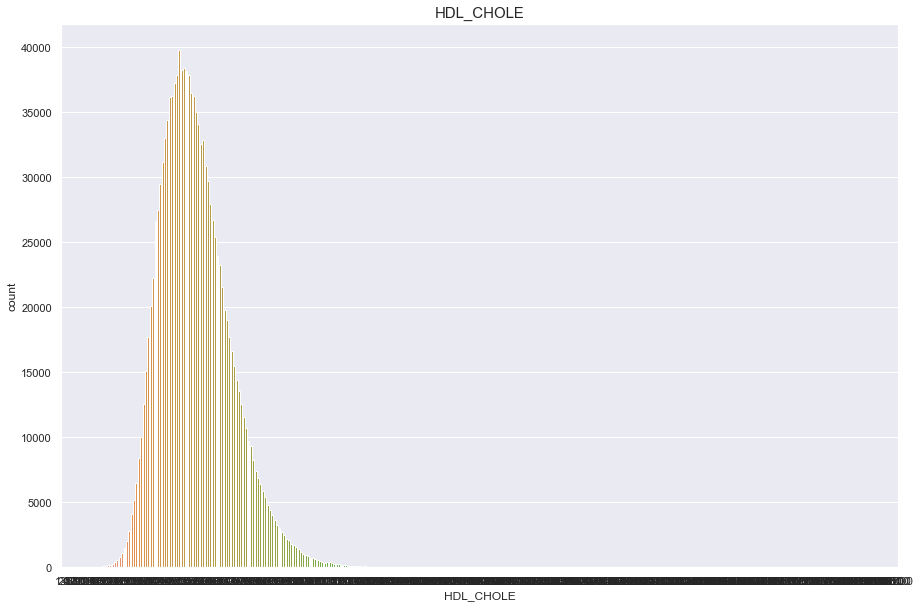
HDL_CHOLE
너무많은 결측치(661347)가 있기 때문에 보류
df['HDL_CHOLE'].isnull().sum()
661347
plt.figure(figsize=(15,10))
sns.countplot(df['HDL_CHOLE'])
plt.title("HDL_CHOLE",fontsize=15)
plt.show()
/Users/minsuha/anaconda3/lib/python3.8/site-packages/seaborn/_decorators.py:36: FutureWarning: Pass the following variable as a keyword arg: x. From version 0.12, the only valid positional argument will be `data`, and passing other arguments without an explicit keyword will result in an error or misinterpretation.
  warnings.warn(
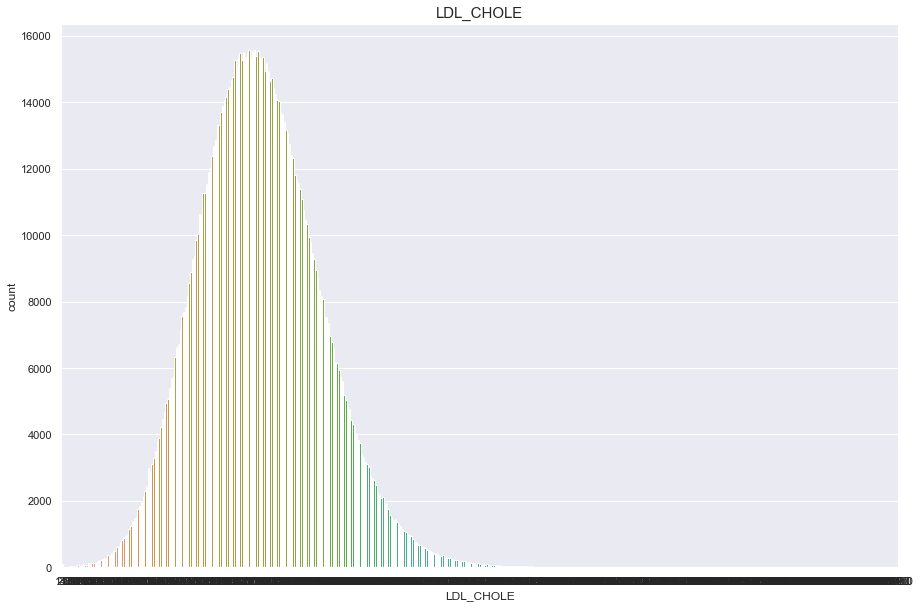
LDL_CHOLE
너무많은 결측치(671083)가 있기 때문에 보류
df['LDL_CHOLE'].isnull().sum()
671083
plt.figure(figsize=(15,10))
sns.countplot(df['LDL_CHOLE'])
plt.title("LDL_CHOLE",fontsize=15)
plt.show()
/Users/minsuha/anaconda3/lib/python3.8/site-packages/seaborn/_decorators.py:36: FutureWarning: Pass the following variable as a keyword arg: x. From version 0.12, the only valid positional argument will be `data`, and passing other arguments without an explicit keyword will result in an error or misinterpretation.
  warnings.warn(
HMG
결측치 26개
- 결측치는 평균치로 넣어준다
정규분포를 따른다.
df['HMG'].isnull().sum()
26
plt.figure(figsize=(15,10))
sns.countplot(df['HMG'])
plt.title("HMG",fontsize=15)
plt.show()
/Users/minsuha/anaconda3/lib/python3.8/site-packages/seaborn/_decorators.py:36: FutureWarning: Pass the following variable as a keyword arg: x. From version 0.12, the only valid positional argument will be `data`, and passing other arguments without an explicit keyword will result in an error or misinterpretation.
  warnings.warn(
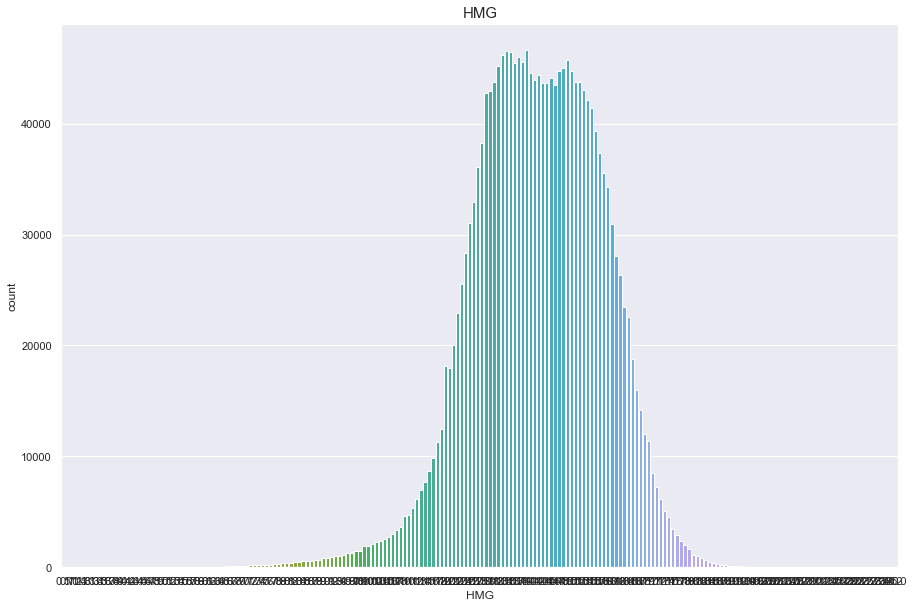
df['HMG'].fillna(df['HMG'].mean(), inplace = True)
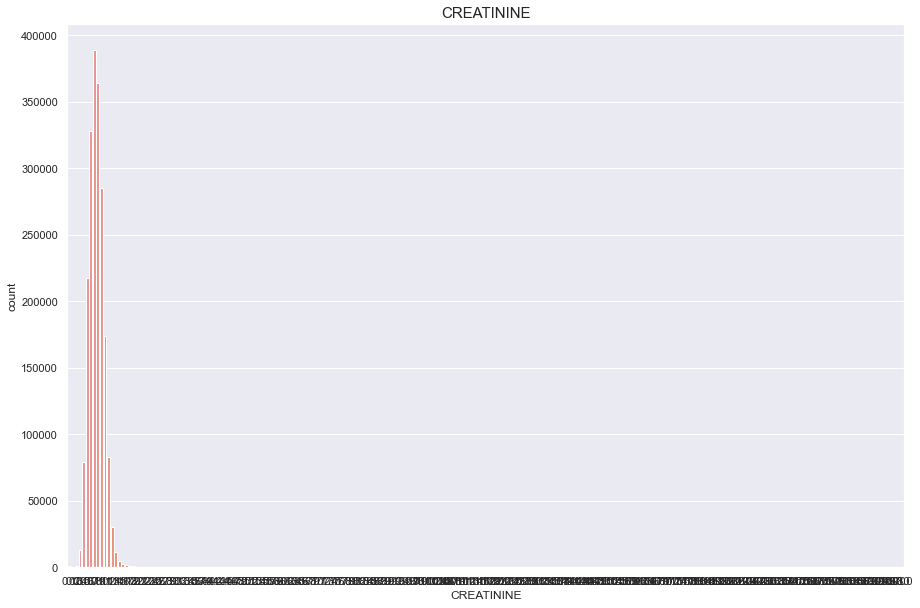
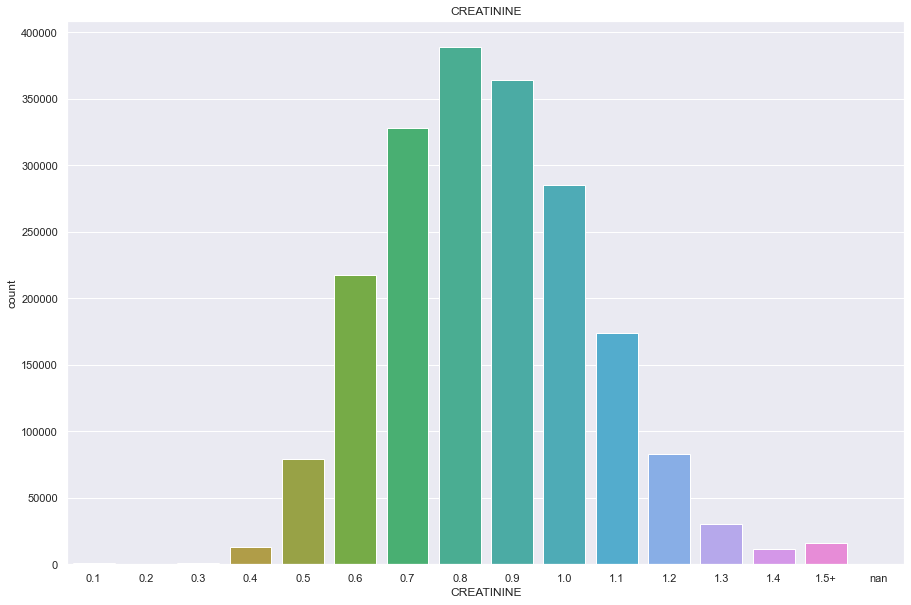
CREATININE
결측치 4개
상위 99% 이상값을 가지는 데이터들을 하나로 묶고 분포도를 출력한 결과 예쁜 정규분포형이 나옴
- 이상치를 제거해도 될듯함
df[df['CREATININE'] > 80]['CREATININE'].value_counts()
96.0    3
90.0    2
86.0    2
98.0    2
93.0    2
87.0    2
95.0    2
89.0    1
84.0    1
83.0    1
97.0    1
92.0    1
85.0    1
94.0    1
81.0    1
Name: CREATININE, dtype: int64
print("Average CREATININE : {:.1f}, 99% of people is {} or less, 1% of people is {} or less, max CREATININE : {}, min CREATININE {}".format(df['CREATININE'].mean(), df['CREATININE'].quantile(0.99), df['CREATININE'].quantile(0.01), df['CREATININE'].max(), df['CREATININE'].min()))
Average CREATININE : 0.9, 99% of people is 1.4 or less, 1% of people is 0.5 or less, max CREATININE : 98.0, min CREATININE 0.1
plt.figure(figsize=(15,10))
sns.countplot(df['CREATININE'])
plt.title("CREATININE",fontsize=15)
plt.show()
/Users/minsuha/anaconda3/lib/python3.8/site-packages/seaborn/_decorators.py:36: FutureWarning: Pass the following variable as a keyword arg: x. From version 0.12, the only valid positional argument will be `data`, and passing other arguments without an explicit keyword will result in an error or misinterpretation.
  warnings.warn(
temp= df.copy()
temp.loc[temp['CREATININE'] > temp['CREATININE'].quantile(0.99)] = '1.5+'
plt.figure(figsize=(15,10))
sns.countplot(temp['CREATININE'].astype('str').sort_values())
plt.title('CREATININE')
plt.show()
/Users/minsuha/anaconda3/lib/python3.8/site-packages/seaborn/_decorators.py:36: FutureWarning: Pass the following variable as a keyword arg: x. From version 0.12, the only valid positional argument will be `data`, and passing other arguments without an explicit keyword will result in an error or misinterpretation.
  warnings.warn(
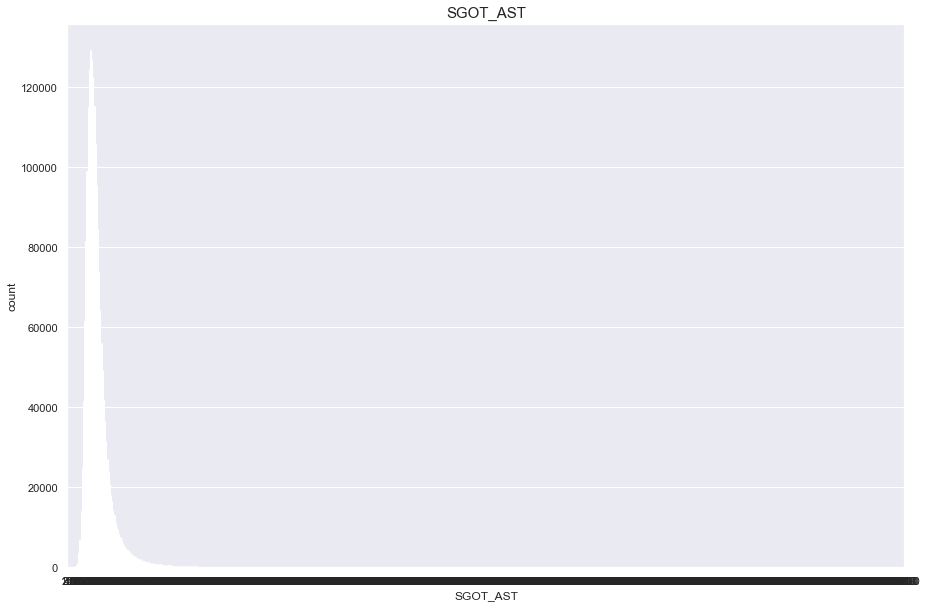
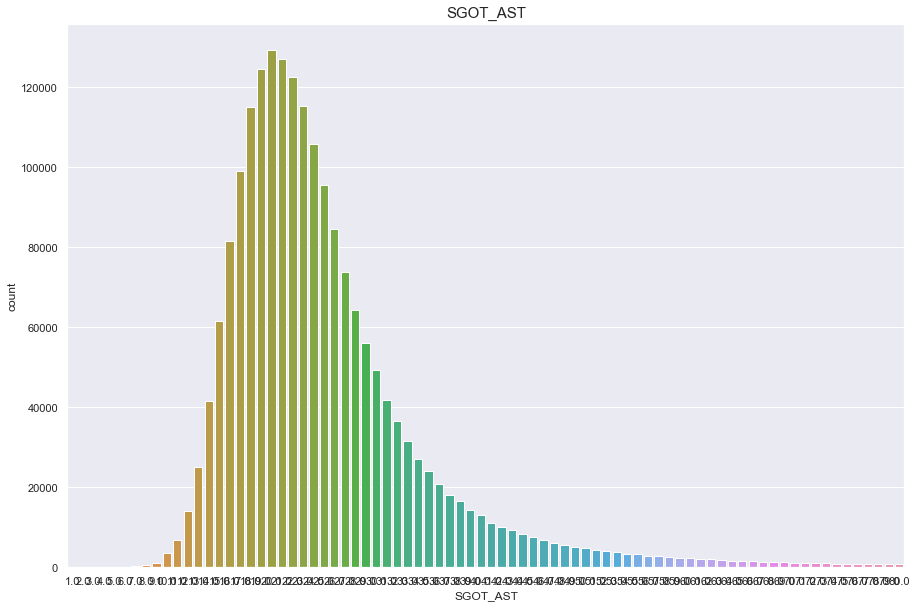
SGOT_AST
결측치 2개
심하게 오른쪽으로 치우쳐진 분포
feature = 'SGOT_AST'
df[feature].isnull().sum()
1
print("Average {} : {:.1f}, 99% of people is {} or less, 1% of people is {} or less, max {} : {}, min CREATININE {}".format(feature, df[feature].mean(), df[feature].quantile(0.99), df[feature].quantile(0.01), feature, df[feature].max(), feature, df[feature].min()))
Average SGOT_AST : 26.1, 99% of people is 81.0 or less, 1% of people is 12.0 or less, max SGOT_AST : 9999.0, min CREATININE SGOT_AST
plt.figure(figsize=(15,10))
sns.countplot(df[feature])
plt.title(feature,fontsize=15)
plt.show()
/Users/minsuha/anaconda3/lib/python3.8/site-packages/seaborn/_decorators.py:36: FutureWarning: Pass the following variable as a keyword arg: x. From version 0.12, the only valid positional argument will be `data`, and passing other arguments without an explicit keyword will result in an error or misinterpretation.
  warnings.warn(
plt.figure(figsize=(15,10))
sns.countplot(df[df[feature] < df[feature].quantile(0.99)][feature])
plt.title(feature,fontsize=15)
plt.show()
/Users/minsuha/anaconda3/lib/python3.8/site-packages/seaborn/_decorators.py:36: FutureWarning: Pass the following variable as a keyword arg: x. From version 0.12, the only valid positional argument will be `data`, and passing other arguments without an explicit keyword will result in an error or misinterpretation.
  warnings.warn(
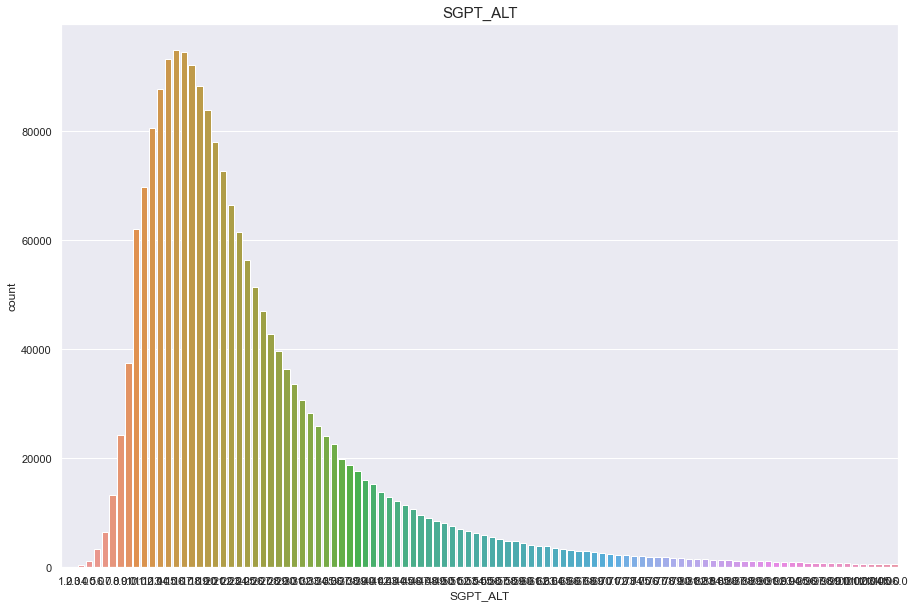
SGPT_ALT
결측치 3개 심하게 오른쪽으로 치우쳐진 분포
feature = 'SGPT_ALT'
df[feature].isnull().sum()
2
print("Average {} : {:.1f}, 99% of people is {} or less, 1% of people is {} or less, max {} : {}, min CREATININE {}".format(feature, df[feature].mean(), df[feature].quantile(0.99), df[feature].quantile(0.01), feature, df[feature].max(), feature, df[feature].min()))
Average SGPT_ALT : 26.0, 99% of people is 107.0 or less, 1% of people is 7.0 or less, max SGPT_ALT : 7210.0, min CREATININE SGPT_ALT
plt.figure(figsize=(15,10))
sns.countplot(df[feature])
plt.title(feature,fontsize=15)
plt.show()
/Users/minsuha/anaconda3/lib/python3.8/site-packages/seaborn/_decorators.py:36: FutureWarning: Pass the following variable as a keyword arg: x. From version 0.12, the only valid positional argument will be `data`, and passing other arguments without an explicit keyword will result in an error or misinterpretation.
  warnings.warn(
plt.figure(figsize=(15,10))
sns.countplot(df[df[feature] < df[feature].quantile(0.99)][feature])
plt.title(feature,fontsize=15)
plt.show()
/Users/minsuha/anaconda3/lib/python3.8/site-packages/seaborn/_decorators.py:36: FutureWarning: Pass the following variable as a keyword arg: x. From version 0.12, the only valid positional argument will be `data`, and passing other arguments without an explicit keyword will result in an error or misinterpretation.
  warnings.warn(
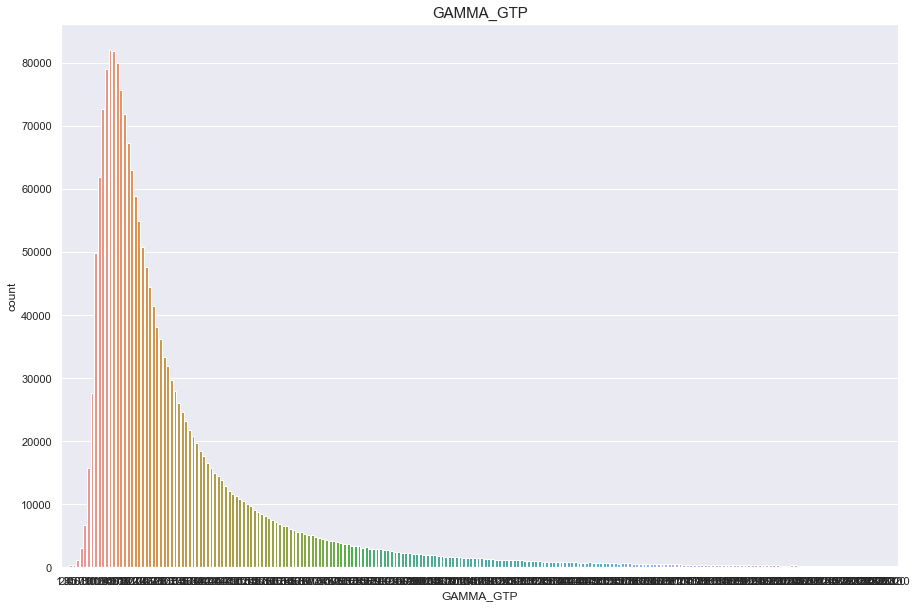
GAMMA_GTP
결측치 6개 심하게 오른쪽으로 치우쳐진 분포
feature = 'GAMMA_GTP'
df[feature].isnull().sum()
0
print("Average {} : {:.1f}, 99% of people is {} or less, 1% of people is {} or less, max {} : {}, min CREATININE {}".format(feature, df[feature].mean(), df[feature].quantile(0.99), df[feature].quantile(0.01), feature, df[feature].max(), df[feature].min()))
Average GAMMA_GTP : 37.4, 99% of people is 233.0 or less, 1% of people is 8.0 or less, max GAMMA_GTP : 999.0, min CREATININE 1.0
plt.figure(figsize=(15,10))
sns.countplot(df[feature])
plt.title(feature,fontsize=15)
plt.show()
/Users/minsuha/anaconda3/lib/python3.8/site-packages/seaborn/_decorators.py:36: FutureWarning: Pass the following variable as a keyword arg: x. From version 0.12, the only valid positional argument will be `data`, and passing other arguments without an explicit keyword will result in an error or misinterpretation.
  warnings.warn(
plt.figure(figsize=(15,10))
sns.countplot(df[df[feature] < 233][feature])
plt.title(feature,fontsize=15)
plt.show()
/Users/minsuha/anaconda3/lib/python3.8/site-packages/seaborn/_decorators.py:36: FutureWarning: Pass the following variable as a keyword arg: x. From version 0.12, the only valid positional argument will be `data`, and passing other arguments without an explicit keyword will result in an error or misinterpretation.
  warnings.warn(
df = df.dropna(subset = ['GAMMA_GTP_BD'], how = 'any', axis=0)
df = df.astype({'GAMMA_GTP_BD': 'int'})